Tool to assist in the review of proposed FIRMs: Falmouth & Bourne.
.Caveats and How to Use This Tool
This map is for informational and planning purposes only. To better understand floodplains, go to our FEMA information page. It is based on FEMA data from early 2013 and other coverages. Resolution of flood areas may be slightly degraded (by about 1 ft horizontal) to reduce file sizes. Please go to the FEMA website for current updates or to make a map of your area. FEMA has not finalized maps for Bourne and Falmouth (and the rest of Barnstable County), so the map for those two towns should be considered draft. Some of the files are large so it may take a minute or two to download with a slow internet connection. Drag the person icon onto the road to get a street view of the area. Click the "x" (top right of the view box) to exit street view mode.
To display the 2013 1% risk flood zone proposed by FEMA for the Towns of Bourne and Falmouth, simply click the box "Proposed Floodplain Map" at the top right. To see approximately how the current floodplain maps prepared in the 1980s compare to the draft maps released by FEMA in 2013, click the box "Old vs New FIRMS". The old versus new firm dataset is an experimental coverage. We took a flawed older digital data coverage and, and in some areas adjusted it to better match aerial photographs to allow comparison to new maps. This methodology is imperfect, and small differences (<75 feet) between the two coverages are not necessarily significant. The resolution of this file coverage was also degraded somewhat to reduce file size to allow its display on with the Google Maps application used on this site.
Discrepancies between the LiDAR datasets and the new FEMA flood insurance rate maps (FIRMs) in Buzzards Bay communities is explained and discussed in this Buzzards Bay NEP 2013 draft technical report .
NOTICE: The floodplain maps shown here are somewhat simplified and are for general planning purposes. They may contain errors or omissions. FEMA has provided a flood insurance program map display page for residents to make maps of their property showing the official flood insurance rate map floodplains.
Google Earth Files
Do you have Google Earth (a free program) installed on your computer? You may find opening the files to the right easier to work with. The files are also more detailed and have more elevations than shown on map on this page (file sizes up to 19 MB).
Example of an Apparent Error in the Draft Floodplain Maps in Falmouth
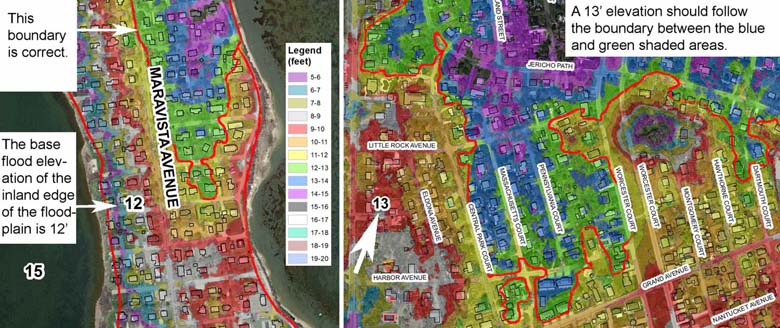
Newly available LiDAR elevation data appear to be the basis for the updated draft flood insurance rate maps (FIRMs) produced by FEMA for Cape Cod. In most of Falmouth and Bourne, there is an excellent agreement between the new LiDAR data and the inland-most boundary of the 1% floodplain. More precisely, the base flood elevation of the landward most portion of the floodplain should reasonably match the LiDAR elevation data. In the map panel to the left below, in the area of Maravista Avenue in Falmouth, the base flood elevation is 12 feet. In this area the flood plain line (red) matches well the 12 foot area (in this case the boundary between the yellow shaded area and the green shaded area. In contrast, in the Falmouth Heights area (right panel), the stated base flood elevation is 13 feet, which is the boundary between the green and blue shaded areas. However, the floodplain boundary in this area appears to be incorrectly set at the 12 foot elevation. This apparent error will need to be addressed in the FIRM review process.

(click the map to enlarge)
Shown above are examples of where the floodplain boundary's base flood elevation is consistent with LiDAR (left), and inconsistent with LiDAR (right). Examples are from 2013 draft floodplain maps for Falmouth, MA. A more detailed view of these and other areas are contained in this map of Teaticket and East Falmouth and this map of Falmouth center.


